
NCCI released the Q3 2020 Quarterly Economics Briefing. The reports detail how the COVID-19 pandemic has affected employment.
By Leonard F. Herk
Since the massive initial wave of layoffs from the coronavirus (COVID-19) pandemic, labor markets are stabilizing, and a clearer picture is emerging of how coronavirus has impacted jobs across sectors and states. Unlike the Great Recession, during which peak unemployment rates developed gradually and were sustained for several years, nationwide job losses peaked in the first two months of the coronavirus recession from February to April and have gradually recovered since then. But while the worst of job losses from the coronavirus pandemic appear to be past, the coronavirus recession continues. Restoring employment levels to pre-pandemic trajectories is likely to take months or even years, especially for the states and economic sectors hardest hit, and some jobs will not come back at all.
Taking stock of the coronavirus recession to date, this report focuses on four key ideas:
Our analysis relies on data from the US Bureau of Labor Statistics’ (BLS) monthly jobs reports at both national and state levels. Our employment metrics are expressed on a seasonally unadjusted basis rather than a seasonally adjusted basis. By design, seasonally adjusted employment “takes out” seasonal variation and expresses monthly employment levels on a normalized annual basis. As a consequence, seasonal adjustment understates actual employment during seasonal peak months and overstates actual employment during seasonal trough months. In our view, metrics of employment change on a seasonally unadjusted basis express month-to-month job losses from the coronavirus pandemic as numbers that are both intuitive and directly relevant to workers compensation.
In the June issue of the Quarterly Economics Briefing (QEB), we discussed employment (or job) losses during the coronavirus pandemic through May. The employment change for a given state and economic sector in the current month was defined to be the percentage change in the state’s actual employment in that sector relative to February, our selected pre-pandemic benchmark.
In this issue, we introduce the concept of an employment (or job) gap. The employment gap for a given state and economic sector in the current month is defined to be the percentage difference in the state’s actual employment in that sector relative to expected employment in the same month. For example, the employment gap in August accounts for seasonal employment variation that would be expected from February to August in a normal, non-pandemic year, whereas the employment change from February to August does not.
In some economic sectors, such as Construction and Education, seasonal employment variations from winter to summer are substantial, making the employment gap concept a more meaningful measure of the pandemic’s effect on jobs than the simple difference in actual employment between two months.
A related concept is the employment gap contribution, which expresses the employment gap for a given state and sector as a percentage contribution to the state’s overall employment gap. National employment gaps and employment gap contributions are defined in the same way as for states.
Table 1 shows actual and expected national employment levels in September and April, together with employment gaps and contributions from different economic sectors. Negative employment gaps indicate employment shortfalls relative to seasonally expected employment levels in either month. Since the initial wave of layoffs through April, national employment shortfalls across all economic sectors recovered during spring and summer but remain elevated in September. Roughly half of the employment gap due to the coronavirus pandemic—from the trough of ‒16.3% in April to ‒7.6% in September—has been recovered to date.
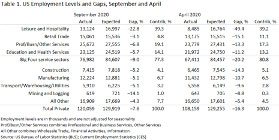
We organize economic sectors into three major groups.
The Big Four service sectors have been dominant drivers of the employment gap during the coronavirus pandemic through September. The Big Four service sectors accounted for 77% of the national employment gap in September and an equal or higher share in every month since April.
Employment gaps in the Big Four service sectors also account for a high and remarkably uniform proportion of employment shortfalls in every state. All of the Big Four service sectors are characterized by high physical proximity, low essentiality, or both. We define physical proximity to mean the degree of interpersonal contact associated with a service or activity and essentiality to indicate the degree to which a service is non-discretionary and cannot be postponed. Physical proximity and essentiality as determinants of coronavirus-related job losses were discussed in the June issue of the QEB.
Neither Manufacturing nor Construction are major contributors to the national employment gap in September, although employment is depressed in both sectors relative to what would be expected in a non-pandemic year. These sectors were significantly hit by job losses in April, but reduced employment gap contributions starting in July suggest that they have begun to adapt to the new pandemic environment.
However, employment shortfalls in Manufacturing and Construction are important in certain states, as we will discuss in the following section. The remaining sectors—Transport, Warehousing, and Utilities and Mining and Logging; and All Other, encompassing Wholesale Trade, Information, and Financial Activities—are minor contributors to employment gaps in most states, but important in a few states.
While variation in employment gaps among states has narrowed since April, it was still substantial in August. State employment gaps in April ranged from ‒25% to around ‒10%; by August the corresponding range was from ‒14% to ‒2% with more than half of states below ‒8% (except Hawaii at ‒20%).
In the June issue of the QEB, we reported on state job losses during the pandemic’s initial phase through April. At that time, we noted regional patterns of state clustering. As states began to reopen in May and June, partial recovery of lost jobs through the summer months has preserved the patterns of geographic clustering that were already evident in April.
Figure 1 groups states by the magnitude of their employment gaps in August and April. In each month, numerical thresholds are selected to define three state groups by rank of their employment gaps: the two lowest quartiles (25 states collectively) and the two highest quartiles (12 and 13 states, respectively).
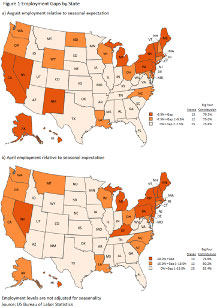
The composition of the three state groups has remained stable from April to August. While many states have shifted their rankings from month to month within a group, major moves from one group to another have been rare. Homogeneity of state groups over time indicates that even as all states have recovered employment since April, relative severities of job losses by state have remained stable. Regional clustering stands out most strongly among states with either relatively high or relatively low employment gaps.
While all states partially recovered lost employment from April to August, the stability of relative rankings demonstrates that states with the biggest employment gaps at the end of summer are by and large the same states that were most severely impacted by the initial pandemic shock to employment in spring. To a significant extent, the states most severely impacted in April, the pandemic’s first month, have remained the most severely impacted since then.
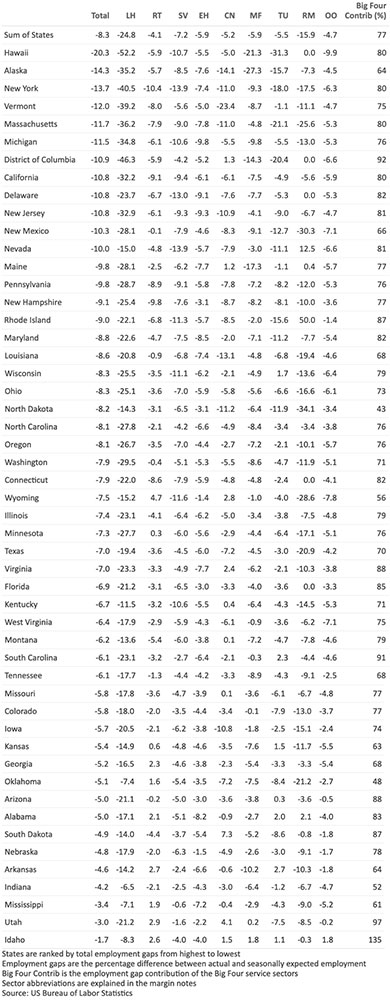
Big Four Service Sectors. The contribution to the employment gap from the Big Four service sectors is remarkably similar, between 75% and 84% for each of the three state clusters shown in Figure 1, and in both April and August. As may be seen in Table 2 at the end of this report, the Big Four service sectors account for a dominant proportion of states’ August employment gaps—above 60% in all but 4 states and above 70% in all but 13 states. These findings indicate that while overall employment shortfalls differ in magnitude across states, underlying patterns of job losses during the coronavirus recession are much more homogeneous across states and dominated by the Big Four service sectors.
Other Sectors. Other economic sectors have been relatively minor contributors to employment shortfalls at the national level. However, the situation is more nuanced for certain states. Figure 2 highlights states where the August employment gap was substantial in economic sectors outside of the Big Four service sectors. Highlighted states are those for which the selected sector contributes significantly to state employment, and the August employment gap in that sector is at least 50% above the national average.

In the June issue of the QEB, we observed that the severity of state job losses during the pandemic’s initial stage through April depended only roughly on state case rates of coronavirus infections. Since then, variations in employment gaps across states have become increasingly independent of the intensity of the coronavirus pandemic in those states, what we refer to as “delinking.”
Figure 3 shows state employment gaps in August and July in relation to the state’s mid-month case rate of confirmed coronavirus infections per 100,000 population.
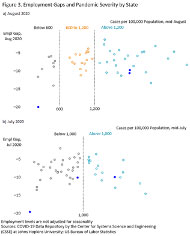
In July (Figure 3b), states with high cumulative coronavirus case rates per capita also tended to have higher employment gaps; but among the remaining states with lower case rates per capita, variation in employment gaps showed no clear correlation with case rates. This is the same pattern we observed in the June QEB in a similar chart showing job losses and coronavirus case rates in April.
Among the 17 states with the highest coronavirus case rates from 1,000 up to over 2,000, July employment gaps were clearly higher in states where the pandemic was already severe in April. Among the remaining 31 states with coronavirus case rates below 1,000, there is no evident relationship between employment gaps and pandemic severity in July. The low severity group includes 5 states with case rates close to the 1,000 threshold, but whose July employment gaps varied from 4% to 10%.
Figure 3a shows the relationship between state case rates and employment gaps in August. With the passage of time, cumulative case rates for all states increased, causing the cloud of points to drift rightward. The weak relationship in July between coronavirus case rates and employment gaps is no longer evident in August. Corresponding to apparent clusters in the August data, Figure 3a places breakpoints at 600 and 1,200 cases per capita to separate states into three groups. The group of 24 states with highest August case rates (above 1,200) retains all states from the corresponding group of 17 states with July highest case rates (above 1,000) but adds 7 other states where coronavirus cases increased during late summer: Tennessee, Texas, Arkansas, California, Idaho, Utah, and North Carolina. It is visually apparent that August employment gaps are not higher for states with higher case rates, either by cluster or for all states collectively.
These findings support the conclusion that states’ employment experiences during the coronavirus-induced recession as of August are largely delinked from the epidemiological progress of the pandemic itself. Delinking does not imply that states are disregarding the pandemic, rather it shows that state responses to the pandemic in terms of economic activity differ significantly.
The preceding discussion suggests that with the passage of time, the coronavirus pandemic and the coronavirus recession are becoming separate entities, related but distinct. There are also distinct epidemiological and economic risk factors associated with each.
Among risk factors related to the pandemic, we highlight the following:
Virus resurgence. July and August saw a resurgence of coronavirus infections, especially in Sun Belt states that reopened more aggressively than other states in May and June. The beginning of the school year presented further uncertainty as some school districts moved forward with plans for face-to-face education and others opted for remote learning. In-person education potentially raises the risk of schools as hot spots, while a shift to remote learning may force some parents to drop out of the labor force in order to stay home with their young children.
Vaccine. Prospects and the timeline for a vaccine remain uncertain. If and when an effective vaccine does become available, questions remain as to how it will be widely distributed throughout the country and whether people will refuse to take it. A September survey reports that nearly half of US adult respondents say they would not get vaccinated if a vaccine to prevent COVID-19 were available today.
In sum, the coronavirus pandemic presents a unique set of risks. It is difficult to say whether infection rates are stabilizing and will gradually improve, whether we are about to face a new and severe wave of infections, or whether we are stuck in a new normal of ebbs and flows.
The future path of the coronavirus pandemic remains uncertain, and the path for the recovery of lost jobs equally so. Meanwhile, consumers and businesses are adapting as best they can. Although government restrictions and public attitudes toward the pandemic differ widely across states, as the US gradually adapts to the reality of coronavirus, the desire to find ways to resume economic activity is strong. An August survey of consumer behavior using smartphone tracking data observed that, “Even in states with major outbreaks, the reduction in business traffic this summer was not as severe as the decline in the spring,” and concludes, “The trends suggest that even as the virus continues to spread, people are less likely to stay home.”
Assuming that we do not experience further waves of lockdowns, employment recovery on a broad scale going forward may depend more on voluntary resumption of activities at affected businesses than on state-mandated restrictions on how those businesses can operate. This line of thinking suggests that the United States is likely to continue on the recovery path begun in May. But what will that path look like? The answer will depend on how quickly pandemic-related job losses are recovered in future and on what jobs do not come back at all.
From the perspective of economic policy, the magnitude of economic disruption makes it challenging to frame and costly to sustain policy interventions of sufficient scale and duration to guide a return to full employment. We frame our discussion of the coronavirus recession under several headings.
Stimulus Measures. Federal fiscal stimulus measures enacted in March as parts of the CARES Act have expired. The Paycheck Protection Program, that funded low-interest, forgivable loans to businesses to be used for retaining workers on payroll, stopped taking new applications in early August. Several other CARES Act programs extending eligibility for unemployment insurance and enhancing benefits— including a federal supplement of $600 per week to state unemployment insurance benefits—expired at the end of July.
Federal support for unemployment benefits has been especially effective in sustaining demand for goods and services during the pandemic. While state unemployment benefits generally replace less than half of lost earnings for most unemployed workers, the federal supplement pushed wage replacement near (or above) 100%, temporarily sustaining as-if-normal consumption spending among people laid off from their jobs. In early August, President Donald Trump signed an executive order to replace the expired supplement at a reduced level of $300 using funds diverted from disaster relief; however, that funding lasted only for six additional weeks, running out the first week of September.
As of this writing, no follow-up relief package to replace the CARES Act has passed Congress, and prospects for a second round of fiscal stimulus before the November elections appear dim. Without continued support for consumer spending, and as temporary layoffs start to become permanent, the partial jobs recovery of the past few months may stagnate, resulting in a protracted economic recovery.
Temporary Layoffs Becoming Permanent. With the expiration and nonrenewal of fiscal stimulus measures, temporary layoffs are increasingly becoming permanent, and a wave of new layoffs may be beginning. Disney recently announced that it would permanently cut jobs for 28,000 previously furloughed workers and American and United Airlines announced new layoffs exceeding 30,000 jobs. While the number of unemployed workers in the US has fallen from 22.5 million in April to 12.3 million in September, the share of unemployed workers by reason of permanent layoff has steadily increased from 9% to 30% over the same period. In September, an estimated 3.7 million unemployed workers were out of jobs because of permanent layoffs; this is nearly three times the number of permanently laid off unemployed workers in September 2019. Permanent layoffs pose a greater threat to economic recovery than temporary layoffs. Workers needing to find new jobs are more likely to experience extended unemployment spells, financial distress, and may need to relocate or accept a job at lower pay than their previous employment.
A Slower Pace of Recovery. Although national and state employment gaps have narrowed in every month since April, the pace of job recovery has slowed. The national employment gap shrunk by more than two percentage points per month from April to June, from ‒16.3% to ‒8.9%, but by six tenths of a percentage point per month thereafter, to ‒7.6% in September. As many states began reopening in May and June after widespread shutdowns in April, the first wave of worker call backs was relatively easy. As the coronavirus recession progresses, further recovery of lost jobs is likely to become progressively slower and more uncertain.
Some Jobs Will Not Come Back. Based on experience to date, jobs that may see permanent post-pandemic employment losses include:
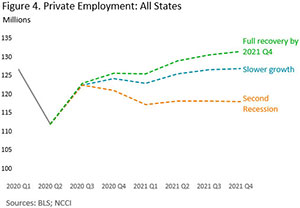
Scenarios for Employment Recovery. Figure 4 shows three scenarios for national employment recovery through 2021, each expressing a different recovery path. The full recovery scenario assumes that the pandemic-induced employment gap, including trend growth, is fully recovered by the end of 2021. The slower growth scenario is calibrated to the Congressional Budget Office’s forecast for expected employment growth, subsequently adjusted by NCCI to account for employment reports released since the CBO report’s publication. This forecast assumes that employment recovery will continue beyond 2021. The second recession scenario is calibrated to the severe downside scenario from Moody’s Analytics.
With three quarters completed, we can forecast with reasonable confidence the employment impact of the coronavirus recession for the full year 2020. Averaging monthly employment gaps from January through September and projecting a range of future gaps for October to December, the national employment gap for 2020 is likely to be somewhere from ‒7.0% to ‒7.5%. This means that average monthly national employment for 2020 is likely to be from 7.0% to 7.5% below what it would have been in the absence of the coronavirus pandemic. This range also provides a reasonable estimate of the first-order effect of employment losses on national workers compensation premium in 2020 relative to what it would have been without the coronavirus pandemic.
A further refinement of the first-order estimate of coronavirus-related employment effects on workers compensation premium requires consideration of the mix of jobs lost during the pandemic. This is less straightforward than it may appear. Two pertinent mix effects come immediately to mind.
V versus K? Scenarios for aggregate employment recovery, like those presented here, are more or less V-shaped, with their rightward arms indicating faster or slower recovery speeds. But the coronavirus recession has hit some economic sectors, states, and workers harder than others and the recovery through August is not refloating all boats equally. The idea is gaining currency that recovery from the coronavirus recession will be K-shaped, a metaphor that draws attention to the recession’s unequal effects across sectors, regions and workers, and suggests that the post-COVID recovery may fundamentally change, not simply rescale, the pre-COVID distribution of jobs and wages.
This report has discussed differential impacts of the coronavirus recession in two dimensions: across states and sectors. We have shown that state employment gaps relative to pre-pandemic employment levels vary significantly through August and that the Big Four service sectors have borne the brunt of job losses in all states. A third dimension of the coronavirus recession’s differential impact is across workers. Layoffs have disproportionately hit lower-wage workers rather than higher-wage workers, in large part because economic sectors most affected by the recession employ a larger-than-average share of lower-wage workers. The accompanying report on “Average Wages During the Coronavirus Pandemic” addresses the topic of how job losses during the coronavirus recession have affected the wage distribution and considers implications for workers compensation.
After job losses peaked in April during the initial phase of the coronavirus pandemic, the employment situation in the United States has begun to stabilize. As consumers, businesses, and state governments adapt to the new reality of coronavirus, a clearer picture is emerging of how the coronavirus pandemic is impacting jobs.
Although all regions of the country partially recovered from May through August and September, employment shortfalls differ substantially across sectors of the economy and across states.
The Big Four service sectors: Leisure and Hospitality; Retail Trade; Professional, Business, and Other Services; and Education and Health Services are the dominant drivers of employment gaps during the coronavirus pandemic so far. Collectively, the Big Four service sectors account for 77% of the national employment gap in both August and September, and a high percentage in every state. All of the Big Four service sectors are characterized by high physical proximity, low essentiality, or both. Manufacturing and Construction are comparatively minor contributors to the national employment gap, although these sectors do figure importantly in some states.
Almost all state employment shortfalls in August, the latest month of data, ranged from 14% to 2%, with half of states below 8%. Overall, we find that state variation in employment gaps to date are best explained by two considerations. First, those states that suffered the greatest job losses through April, during the pandemic’s initial phase, remain those with the biggest employment shortfalls since then. Second, for the majority of states less severely impacted by the pandemic, employment gaps appear to be better explained by regional clustering than any other factor.
Absent a new wave of lockdowns, it appears that employment recovery in the US is likely to continue along a recovery path that was begun in May. What that path will look like depends on two key unknowns: how quickly job losses recover to pre-pandemic levels in different economic sectors and across states and what jobs do not come back at all.
While less strongly driven by the coronavirus pandemic, the coronavirus recession continues. After relatively rapid job recoveries from initial state reopenings during the summer, we may now be entering a harder stage of economic recovery as the pace of job recovery has slowed and an increasing share of unemployed workers do not expect their old jobs to come back.
© Copyright 2005–2020 NCCI Holdings, Inc. All Rights Reserved.
THE RESEARCH ARTICLES AND CONTENT DISTRIBUTED BY NCCI ARE PROVIDED FOR GENERAL INFORMATIONAL PURPOSES ONLY AND ARE PROVIDED “AS IS.” NCCI DOES NOT GUARANTEE THEIR ACCURACY OR COMPLETENESS NOR DOES NCCI ASSUME ANY LIABILITY THAT MAY RESULT IN YOUR RELIANCE UPON SUCH INFORMATION. NCCI EXPRESSLY DISCLAIMS ANY AND ALL WARRANTIES OF ANY KIND INCLUDING ALL EXPRESS, STATUTORY AND IMPLIED WARRANTIES INCLUDING THE IMPLIED WARRANTIES OF MERCHANTABILITY AND FITNESS FOR A PARTICULAR PURPOSE.

Forging the Next 250 Years: Powering the Next Era of American Manufacturing
As manufacturers offer more customization than ever before, managing product complexity has become a critical challenge. Tune in with Dan Joe Barry, Vice President of Product Marketing at Configit, who explores how companies are tackling the growing number of product configurations across engineering, sales, manufacturing, and service. He explains how Configuration Lifecycle Management (CLM) helps organizations maintain a single source of truth for configuration data. The result: fewer errors, faster quoting, and the ability to deliver customized products at scale.
Get In Touch
Google news and SEO compliant, Industry Today’s state-of-the-art digital media platform offers bespoke media campaigns that target key decision makers and buyers to achieve your marketing and promotional goals.
![]()
Contribute
Showcase your brand and promote your business to our highly targeted audience. We offer detailed Google Analytics with measurable ROI to assure success. Submit your content for review by our Editorial team who will contact you to discuss the project further.
About Us
Reach Your Targeted Audience and Grow Your Business. Learn more About Industry Today.
Contact Us

© 2026 Industry today. All Rights reserved.