Insights into global container vessel emissions emphasizes the critical role of accurate data in reducing maritime carbon footprints.
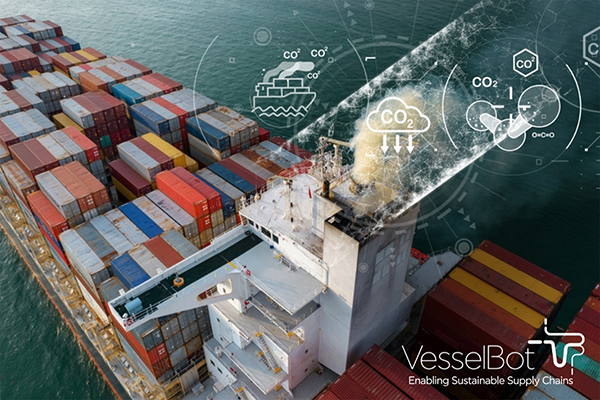
In the face of escalating climate concerns, the maritime industry stands at a crossroads. With international shipping responsible for about 3% of global greenhouse gas emissions (according to World Economic forum), accurate tracking and reduction of these emissions have never been more crucial. VesselBot’s recent “Decoding Maritime Emissions” report offers groundbreaking insights into this complex issue, highlighting the transformative power of primary data in steering the industry towards a sustainable future.
Contrary to popular belief, the report’s most startling revelation is that short-range voyages, not long-haul trips, are the biggest contributors to global emission intensity. These journeys, averaging just 1,669 km, often exceed 1,000 WTW* g CO2e/TEU-km in intensity. This finding challenges conventional wisdom and underscores the urgent need for optimized route planning and improved port management, especially for feeder vessels under 3,000 TEU capacity.
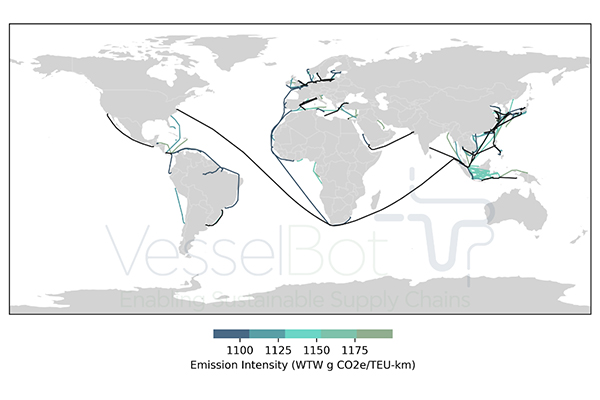
The report’s detailed analysis reveals that many of these high-intensity voyages occur within Asia, intra-America, and the Mediterranean Sea. Surprisingly, the ports involved in these voyages often don’t rank among the world’s top 20 busiest ports, highlighting a critical area for emission reduction efforts that might otherwise be overlooked.
VesselBot’s data shows that the vessels conducting these short-range, high-intensity voyages are typically older, with 24% being more than 20 years old as of May 2024. These ships often travel at lower speeds (averaging 13 knots) and perform excessive maneuvering in and out of ports, significantly reducing overall voyage efficiency and increasing CO2 emission intensities.
The report provides a nuanced view of emissions by flag state, moving beyond simplistic total emissions calculations. While Liberia boasts the largest fleet and highest total CO2 emissions, its per-vessel intensity is relatively low, indicating good voyage and vessel efficiency. Surprisingly, the Faroe Islands, with just five ships, shows the highest average intensity at 472 WTW g CO2e/TEU-km.
This granular analysis enables more targeted and effective emission reduction strategies. For instance, the report reveals that Cayman Islands flag vessels demonstrate the lowest average intensities at 95.4 WTW g CO2e/TEU-km, despite having only three ships in their fleet. Such insights allow for a more nuanced approach to emissions reduction, focusing on fleet composition and operational efficiency rather than just total fleet size.
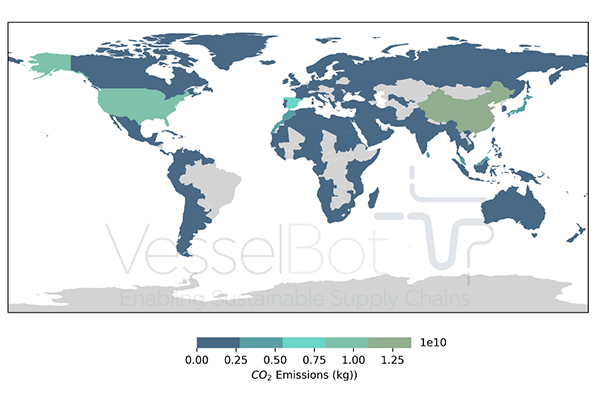
Unsurprisingly, China emerges as the largest contributor to cumulative emissions globally, followed closely by the United States. However, VesselBot’s data reveals that emission patterns vary significantly even within these countries, emphasizing the need for port-specific and route-specific emission reduction strategies.
The report quantifies China’s contribution at 140 million kg of CO2, while the USA follows with 110 million kg. Notably, the USA saw 4,931 voyages to and from its ports in the first quarter of 2024 alone. This level of detail allows for targeted interventions at the busiest ports and along the most frequently traveled routes.
VesselBot’s report stands out for its use of primary data, offering unprecedented accuracy in emissions tracking. By considering factors such as actual distance traveled, voyage speed, vessel load factor, and ship-specific parameters, VesselBot provides a more realistic and actionable picture of maritime emissions.
This approach allows for microscopic investigations down to vessel-specific levels, enabling businesses to make informed decisions that genuinely reduce their carbon footprint. For instance, VesselBot’s data shows clear relationships between CO2 emissions, emission intensity, and various operational parameters, allowing for predictive modeling and optimization.
The report demonstrates how VesselBot’s primary data approach can reveal significant discrepancies from industry-standard averages. For example, while some methodologies set fixed values for intra-Northeast and Southeast Asia trade lanes, VesselBot’s data shows that CO2 intensity values can actually exceed 1120 WTW g CO2e/TEU-km in these areas, far higher than standard estimates.
As the maritime industry grapples with the International Maritime Organization’s goal of a 70% emission reduction by 2050, the insights from VesselBot’s report become invaluable. By leveraging accurate primary data, shippers and other market stakeholders can precisely track their environmental impact, identify inefficiencies, and implement targeted operational optimization reduction strategies that do not require any CAPEX investments.
The report’s findings underscore the importance of vessel-specific and voyage-specific data. For instance, the relationship between speed and emission intensity varies significantly between vessels, even on similar routes. Similarly, instead of assuming that all vessels carry 70% of their total TEU capacity on every voyage, which leads to misrepresentation of emissions, having a more accurate utilization factor can yield far more accurate calculations. This level of detail enables shippers to optimize their operations using granular-level data.
The path to maritime sustainability is complex, but with tools like VesselBot’s emissions visibility system, it becomes navigable. By embracing this data-driven approach, the maritime industry can not only meet its environmental obligations, but also optimize its operations for a more efficient and sustainable future.
For more information, visit www.vesselbot.com.

Constantine Komodromos – Founder & CEO, VesselBot
Constantine is a Fellow member of the Association of Chartered Certified Accountants (FCCA) UK and has more than 23 years of working experience in several multinational organizations and building startups.
He has acquired significant market experience and knowledge of the Logistics industry via collaborations with NASDAQ and NYSE-listed organizations.
Constantine since 2015 has founded and managed VesselBot, a technology company that provides the market with the most accurate GHG Emissions Monitoring System for the main supply chain transportation modes (vessels, airplanes, trucks, and trains).
* Well-to-wheel (WTW) emissions refer to all greenhouse gas emissions from the production, transportation, transformation and distribution of the fuel combusted by the vehicle

Industry in Transition: The Forces Reshaping Manufacturing
As manufacturers offer more customization than ever before, managing product complexity has become a critical challenge. Tune in with Dan Joe Barry, Vice President of Product Marketing at Configit, who explores how companies are tackling the growing number of product configurations across engineering, sales, manufacturing, and service. He explains how Configuration Lifecycle Management (CLM) helps organizations maintain a single source of truth for configuration data. The result: fewer errors, faster quoting, and the ability to deliver customized products at scale.
Get In Touch
Google news and SEO compliant, Industry Today’s state-of-the-art digital media platform offers bespoke media campaigns that target key decision makers and buyers to achieve your marketing and promotional goals.
![]()
Contribute
Showcase your brand and promote your business to our highly targeted audience. We offer detailed Google Analytics with measurable ROI to assure success. Submit your content for review by our Editorial team who will contact you to discuss the project further.
About Us
Reach Your Targeted Audience and Grow Your Business. Learn more About Industry Today.
Contact Us

© 2026 Industry today. All Rights reserved.