
With IoT and big data, there’s an increased need for robust wireless connectivity in the industrial and manufacturing sectors.
Over the last decade, digital transformation has been sweeping all industries, and the manufacturing and industrial sectors are no exception here. With an increased demand for customization, the growing complexity of the global supply chain, and rising customer expectations, companies in these sectors focus on innovative ways to stay competitive. One key area of focus is IoT and data.
Today, companies generate an immense amount of data daily. This data can be anything from custom behavioral data, supply chain data, industrial machine data (heat and pressure metrics), and so on. For industrial and manufacturing, utilizing this data and leveraging smarter wireless-based technologies comes with a multitude of benefits, including:
Having fast and robust WiFi is paramount to this technological progression. Without it, companies in these sectors can’t effectively implement and utilize IoT sensors and automation technologies, and as a result, miss out on the benefits. A weak or unreliable wireless connection can mean sensors go offline, productivity drops, and safety is compromised.
However, WiFi strength is just as much about power as it is about optimization. If you measure WiFi signal strength in one area of the plant and it comes back as strong, then great. But a strong signal is only great if it’s in the areas you need it – the areas with high dependence on wireless connectivity. This is why measuring WiFi signal strength across the entire area is so important – it empowers companies to make the best optimizations and get peak efficiency from their WiFi.
With WiFi analysis apps like NetSpot, industrial and manufacturing companies can analyze their WiFi networks’ health. It does this in several ways, including using WiFi signal strength meters for all wireless networks and using heatmaps to identify WiFi “dead spots.”
The first step in the process is to analyze the WiFi networks in the surrounding area. First, you need to download and install NetSpot and then launch the app. You’ll notice two modes immediately, Discover and Survey. To measure the WiFi signal strength for all networks, including viewing the WiFi signal strength meter, you need to select Discover mode.
Once the scan is complete, you can see key WiFi metrics for all networks, including Signal to Noise Ratio (SNR), frequency band (2.4 GHz or 5 GHz), WiFi channel, WiFi vendor, noise, and more.
For a comprehensive visual view of the WiFi signal strength across the WiFi perimeter, a WiFi heatmap is the way to go. WiFi heatmaps use color to display where the signal is the strongest and weakest across the network. In NetSpot, this is done through the Survey mode, like this:
Your completed heatmap will look like this:
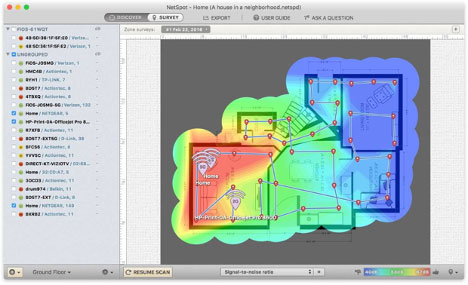
WiFi heatmaps are a great visualization tool, allowing you to see WiFi strong spots and dead spots at a glance.
Once you’re done measuring your WiFi signal strength, it’s time to start optimizing your network. You might find that there’s too much noise in some areas of the plant due to WiFi inhibiting devices or because too many devices are competing for bandwidth. Whatever the reason, you now know how to rectify the issue for a more fast and reliable network.
 About the Author:
Nancy is a technology writer who specialises in IoT, cybersecurity, and data science. She can be contacted on LinkedIn at https://www.linkedin.com/in/nancy-driver-1a2862191/

Industry in Transition: The Forces Reshaping Manufacturing
As manufacturers offer more customization than ever before, managing product complexity has become a critical challenge. Tune in with Dan Joe Barry, Vice President of Product Marketing at Configit, who explores how companies are tackling the growing number of product configurations across engineering, sales, manufacturing, and service. He explains how Configuration Lifecycle Management (CLM) helps organizations maintain a single source of truth for configuration data. The result: fewer errors, faster quoting, and the ability to deliver customized products at scale.
Get In Touch
Google news and SEO compliant, Industry Today’s state-of-the-art digital media platform offers bespoke media campaigns that target key decision makers and buyers to achieve your marketing and promotional goals.
![]()
Contribute
Showcase your brand and promote your business to our highly targeted audience. We offer detailed Google Analytics with measurable ROI to assure success. Submit your content for review by our Editorial team who will contact you to discuss the project further.
About Us
Reach Your Targeted Audience and Grow Your Business. Learn more About Industry Today.
Contact Us

© 2026 Industry today. All Rights reserved.