Example of center of gravity analysis for a retail network and discussion around getting from 50% to 90% service level.
By Marianna Vydrevich, Supply Chain Network Design Expert, Manager of Advanced Analytics in Operations at GAF, North America’s largest roofing manufacturer
According to last year’s Gartre survey, 51% of respondents said they increased the number of locations in their supply chain in the past year. As costs continue to rise, so do customers’ expectations of same-day and next-day deliveries. Supply chain managers are faced with a pressing question: what level of service is realistic to aim at?
This is where supply chain network design comes in handy. One common method used to determine how many distribution centers a company needs to achieve its target service level is the Center of gravity analysis. The method creates a weighted average for the location of all destinations, where the weights are typically the quantities of goods supplied or consumed at each destination. The ‘center of gravity’ is the optimal location that minimizes the total distance of moving goods between the facility and its associated destinations. In its most basic form, the center of gravity analysis requires only one data input – demand by location.
For the following example, we’re going to design a network for a fictitious US company that is looking to enter the market selling common household products. Since there is no shipment or order history available, the supply chain network design team has decided to use the US Census bureau data, specifically the US population by county code for 2022 as the starting point. The team wants to perform a center of gravity analysis for various service level thresholds to see how many locations they would need to open. In every scenario, a network configuration is derived with the minimal number of distribution centers necessary to be within 10 miles of the given percentage of the population.
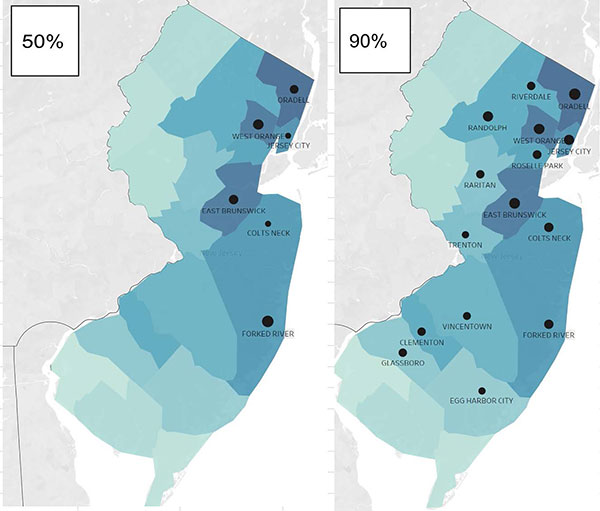
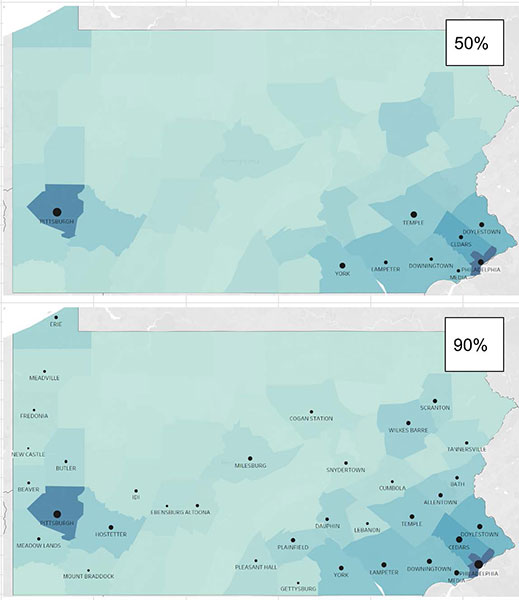
If the company decides to open the locations in New Jersey, then in order to be within 10 miles of 50% of the population the network would have to consist of 6 locations. If, however, the company decides to open in Pennsylvania, it would need 9 locations to achieve the same service level. In order to have 90% of the population within 10 miles, the minimum number of locations goes up to 15 for New Jersey and 35 for Pennsylvania.
Picture 1: Minimal number of distribution centers for 50% and 90% service level in NJ.

Picture 2: Minimal number of distribution centers for 50% and 90% service level in PA.

When expanded to the whole mainland US, the required number of locations for different service levels resembles an exponential line up to the 95-96% threshold. After that, it starts to increase faster.
Before the 90% threshold, every 10% increase in the service level means, at a maximum, doubling the number of locations. While getting from 80 to 90% service level requires adding 51 locations for every percentage point, getting from 90 to 99% requires adding 147 locations for every percent. Most large retailers want to stay under a 90% service level because of the higher-than-exponential costs of going any further: Walmart and Home Depot aspire to a 90% service level, while Target aspires to 75%.
Picture 3: Increase in the number of distribution locations for different service level thresholds

There are, naturally, several limitations to the center of gravity analysis. It does not take into account many important factors: warehouse capacity, labor and storage costs, seasonality, and – arguably the most important factor – freight. The simplest form of center of gravity analysis assumes that freight costs rise linearly as the distance between origin and destination increases, but that is not the case in all markets. It is not uncommon to see the difference in shipping costs between origin – destination and destination – origin to be around 30%, which could be high enough to outweigh other factors in the optimization model.
This particular analysis was performed using county codes as the data source. Relying exclusively on this data could lead to a misleading result: in San Bernardino county, California, where the population density is very uneven and the total area is over 60 square miles, a center of gravity analysis suggests that a distribution center should be located in the middle of the Mojave Desert. Going to a postal code level of detail is likely something that would be required to validate the results of this analysis.
Despite these limitations, center of gravity analysis is a useful method frequently used in supply chain network design. It is the quickest way to estimate the footprint a company would need to achieve a certain service level, and it can be used as a starting point for a full-scale network optimization.
Scott Ellyson, CEO of East West Manufacturing, brings decades of global manufacturing and supply chain leadership to the conversation. In this episode, he shares practical insights on scaling operations, navigating complexity, and building resilient manufacturing networks in an increasingly connected world.