To better understand injuries within the transport sector, Atlas IPS studied discomfort survey data collected from 102,749 truck drivers.
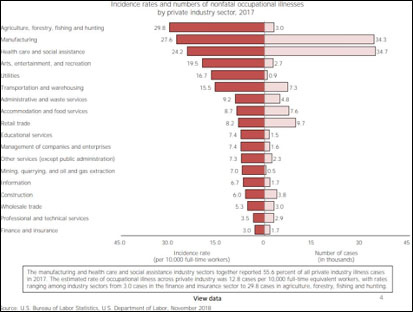
According to the U.S. Bureau of Labor Statistics, there has been an overall downward trend in the number of reported heavy and tractor-trailer truck driver injuries and illnesses over the last number of years. However, in its 2017 report, the transportation and warehousing sector still has the 6th highest nonfatal occupational illness incidence rate and the 5th highest number of cases of all private industry sectors.
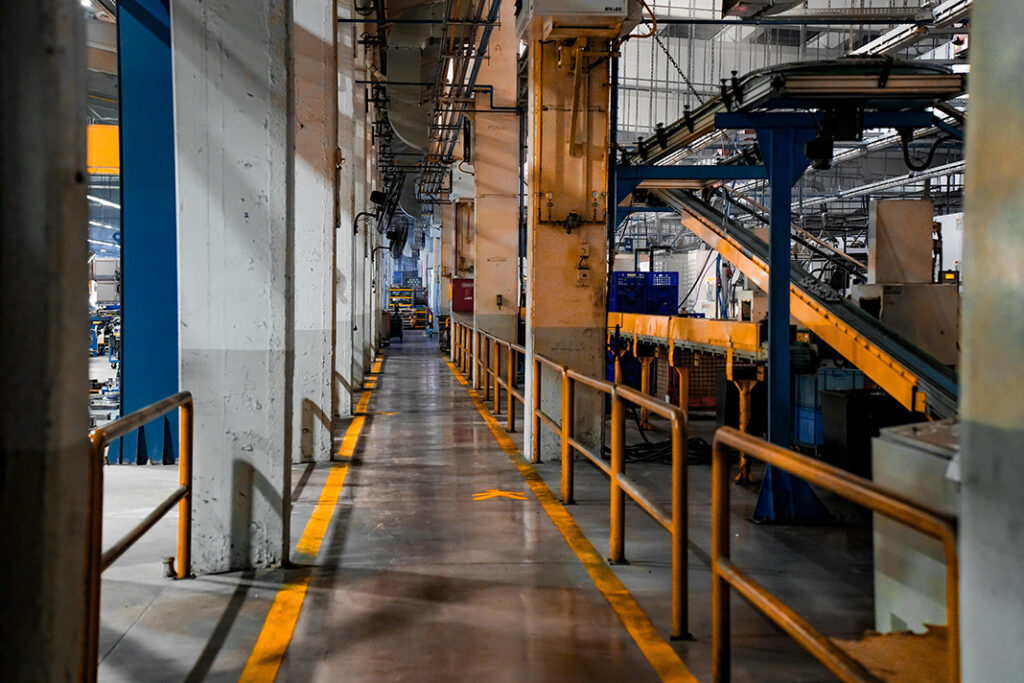
In an effort to better understand injuries within this industry sector, Atlas Injury Prevention Solutions (Atlas) studied discomfort survey data collected from 102,749 truck drivers. The data was generated from a subset of Atlas clients served over a 10-year period (2008-2017).
Of the 102,749 drivers who completed the survey, 46% reported having some level of discomfort. From our perspective, discomfort is a critical metric. Our experience and other research studies have found discomfort is a strong early predictor of a potential injury, related cost and administration, and loss of capacity. Therefore, if discomfort is better understood, preventative strategies can be defined and implemented to mitigate the risk.
Beyond injury risk it is worth noting discomfort can also be a distracting force on a driver. If a driver is experiencing discomfort, especially higher levels of discomfort, it can become more difficult to focus, respond, and react, placing the driver at a higher risk for motor vehicle accident.
The focus of this study was to compare driver discomfort and demographic information–height, body mass index (BMI), age, and gender—to see if there were any statistically significant correlations. We believe our findings below are quite interesting.
Height: Given the seating industry’s focus on effectively fitting the range between the 5th percentile for females and the 95th percentile for males, it might be expected that there will be a higher percentage of discomfort in the extreme height ranges (<5’4” and >6’3”). However, the only pattern shown within the study is with shorter drivers. The mean height of the data set is 5’10”. As the height of the driver decreases from the mean, it correlates with a higher prevalence of discomfort. Surprisingly, as the height increases past the mean there in no correlation with prevalence of discomfort.
When we look at different regions of the body, we found some notable correlation with driver height:
These findings align with what we see in the field. When we fit a cab to a driver to help them avoid discomfort, the tolerance for error is larger with taller individuals where several accommodation options exist. Shorter individuals have fewer options.
BMI: One of the most frequently referenced demographic categories in current research is BMI. Multiple studies have found significantly higher average BMI in truck drivers than in the general population. Consistent with those studies our dataset showed 48% of the drivers were obese—26% higher than the national average—and 85% of the drivers were overweight or obese—20% higher than the national average.
Other research has shown a positive correlation between BMI and medical cost claims and lost work days. In further support of that research our dataset showed a positive correlation between BMI and both the prevalence of discomfort and average total discomfort.
When we look at different regions of the body, we found some notable correlations with higher BMI drivers:
These findings also align with what we see in the field. Head/neck, shoulder, and low back discomfort impact all drivers and is not driven by obesity alone. The discomfort is driven by long hours of seated work in a less than optimal position. However, as a driver’s BMI increases, complaints escalate.
Age: Another area of considerable discussion and research is on the impact of the aging workforce, which is especially important given the desire to keep older workers healthy and productive. Other researchers would lead us to expect higher discomfort as drivers age.
As expected, our dataset shows a positive correlation between age and the prevalence of discomfort. However, there is less of a correlation been age and total average discomfort. In short, more older workers hurt, but likely no more than their younger peers.
When we looked at different regions of the body, we saw some unique patterns between the age groups:
These findings also make sense to us, but more from a medical perspective than a field one. Aging has an overall impact, but particularly with the upper portion of the spine and the eye.
Gender: An area of growing discussion is the impact of gender. Historically driver positions have been held by men, further confirmed by this study where only 7% of the respondents were women. Given the industry’s driver shortage, there is an increasing need to attract women to the job, but making sure they can safely do the work must be a consideration.
When looking at gender and its correlation with discomfort, it is necessary to first look at whether it is gender or the physical differences between the genders that influences discomfort. If we compare the overall demographics between the male and female populations within our study, we find the following:
Average height: Males: 5’10” Females: 5’5”
Average BMI: Males: 31 Females: 32
Average age: Males: 46 years Females: 45 years
Height is the only significant gender driven demographic difference. Therefore, while we will analyze gender, it is important to always consider the broader impact of height.
Our dataset shows a low correlation between gender and the prevalence of discomfort but a positive correlation between gender and average total discomfort. In short, female workers don’t report discomfort any more frequently than their male counterparts, but when they do their discomfort level is higher.
When we looked at different regions of the body, we saw some notable patterns between genders:
These findings also align with our field experience and previous discussion about driver height. In addition, the increase in shoulder discomfort is not surprising given that a 30-year-old female statistically has 65% of the shoulder strength of their male counterparts.
Given what our data has told us, it is natural to wonder how this might impact a fleet’s approach to mitigate injury risk. Given our experience, we recommend the following:
Height: Focus on the needs of shorter employees (i.e. <5’4”). Emphasis should be placed on proper cab setup to provide an effective line of sight, as well as back support, and to decrease the need for the shorter driver to reach out for the steering wheel.
BMI: Given the higher prevalence of discomfort with higher BMI workers, implement programs to address discomfort early and proactively, including telephonic or onsite early intervention. Focus on the knee, low back, and head/neck discomfort for employees in any of the obese categories (BMI >30) through proper cab setup. An aggressive wellness program is recommended to address exercise needs, along with the nutritional challenges of drivers.
Age: Given the higher prevalence of discomfort with aging workers, implement programs to address discomfort early and proactively, including telephonic or onsite early intervention. Focus on the eyestrain through bi-annual eye exams and possible use of glare-reducing lenses for nighttime driving. With younger employees, provide programs to reinforce good work habits to reduce low back pain and future injury risk.
Gender: Although there is an increase in total discomfort seen with female participants, the data indicates this is due to employee height. Emphasis should not be placed on employees due to gender but should focus on other demographic characteristics.
Understanding the correlation, or lack of correlation between discomfort and driver demographics allows fleets to prioritize their time and money in areas where they can have the most impact on mitigating injury risk. Sometimes it is more important to understand “why” before you focus on “how.”

Industry in Transition: The Forces Reshaping Manufacturing
As manufacturers offer more customization than ever before, managing product complexity has become a critical challenge. Tune in with Dan Joe Barry, Vice President of Product Marketing at Configit, who explores how companies are tackling the growing number of product configurations across engineering, sales, manufacturing, and service. He explains how Configuration Lifecycle Management (CLM) helps organizations maintain a single source of truth for configuration data. The result: fewer errors, faster quoting, and the ability to deliver customized products at scale.
Get In Touch
Google news and SEO compliant, Industry Today’s state-of-the-art digital media platform offers bespoke media campaigns that target key decision makers and buyers to achieve your marketing and promotional goals.
![]()
Contribute
Showcase your brand and promote your business to our highly targeted audience. We offer detailed Google Analytics with measurable ROI to assure success. Submit your content for review by our Editorial team who will contact you to discuss the project further.
About Us
Reach Your Targeted Audience and Grow Your Business. Learn more About Industry Today.
Contact Us

© 2026 Industry today. All Rights reserved.