A Canadian producer found $660,000 a month in chemical cost variance, hidden in the gap between planned and actual chemical injection rates.
By Michael Jones, CEO, Embark Innovations Inc.
A major Canadian oil and gas producer recently discovered it had been carrying $660,000 a month in chemical cost variance. Nobody had hidden it. Nobody had stolen it. It simply lived in the gap between the chemical that was supposed to be injected into each well and the chemical that actually was, and no system the company owned could see that gap.
That producer is not unusual. Across the North American oilfield, production chemicals are one of the largest controllable line items in lifting cost, and one of the least measured. Paraffin inhibitors, corrosion inhibitors, scale inhibitors, H2S scavengers, biocides and demulsifiers are injected continuously or batched into thousands of wells, flowlines and tanks every day. The dosing decisions behind that spend are usually made in a chemical vendor’s spreadsheet, confirmed in a monthly PDF and never reconciled against what the well actually produced.
This article is about why that happens, what it costs, and the practical steps operators and chemical companies are taking to close the gap.
Most production chemical programs are managed on trust because they grew up that way. A chemical vendor wins a field, sets target injection rates in parts per million, schedules field technicians to check pumps and tanks, pulls samples for the lab and sends the producer a monthly report. The producer reviews the invoice, maybe spot-checks a few sites and approves it.
The arrangement works until someone asks a simple question: was the target rate achieved at every injection point last month, and what did it cost per barrel of oil equivalent to achieve it?
Answering that question requires four data sets that almost never sit in the same place:
Each of those is owned by a different party, updated on a different cadence and stored in a different format. The only place they meet is in someone’s head, usually at the end of the month. By then the chemical has been injected and the invoice is in the queue.
The gap between target and actual dosing has a name: treatment variance. In programs we have measured, 15 to 20 percent variance is normal before any correction is applied. It is not a sign of a bad vendor. It is what happens when pump rates are set against last month’s production, a well’s water cut changes, a pump drifts and nobody has a daily view of all three at once.
Variance cuts both ways, and both directions cost money.
Over-treatment is the obvious one. Chemical is injected that the well does not need, invoiced and consumed. In the $660,000-a-month case above, the producer’s PPM variance across its program was running above 300 PPM. After the four data sets were reconciled in one system, variance fell to 29 PPM. The savings were not a negotiated discount; they were chemical that no longer had to be bought.
Under-treatment is the expensive one. A paraffin program running 20 percent light does not show up on the invoice; it shows up as a hot-oil truck, a lost day of production and, eventually, a flowline failure. A corrosion program running light shows up as an integrity event years later. The cheapest chemical program on paper is often the one that costs the most in operations.
The third cost is administrative. One vendor we work with was spending roughly 30 staff-days a month moving numbers between field tickets, spreadsheets and client reports before it automated the chain. That is a full-time engineer doing data entry.
The calculation itself is not complicated. For a continuous injection point, the actual treatment rate in PPM is the chemical injected, converted to volume per day, divided by the fluid produced that day and multiplied by one million. Compare that to the target PPM and the difference is the variance for that well on that day.
The reason it is rarely done is that the two inputs come from different owners on different days. The pump rate belongs to the vendor’s field tech. The fluid volume belongs to the producer’s production accountant, who allocates it weeks later. By the time both numbers exist, nobody is looking.
Three changes make the arithmetic routine instead of heroic:
Once the comparison is visible every day, variance tends to fall on its own. Field staff correct pumps they can now see are off. Programs we have measured typically move from the 15 to 20 percent range to under 5 percent within two quarters, and in one Western Canadian vendor’s program net treatment variance fell by more than 90 percent.
Treatment accuracy answers whether the planned chemical reached the well. It does not answer whether the plan was right. That is the lab’s job, and it is the part of the loop most often left open.
A scale program should be judged against residual inhibitor, iron and manganese and suspended solids in produced water. A biocide program should be judged against sulphate-reducing and acid-producing bacteria counts trended over time. A corrosion program should be judged against coupon and probe rates. In most operations those results exist, but they sit in a lab system that has no idea what was injected the week the sample was pulled.
When lab results are tied to the injection history of the same point, the program manager can finally see cause and effect: bacteria counts rising three weeks after a biocide batch was missed, residual scale inhibitor falling as water production climbs past the rate the pump was set for. That is where dosing decisions should come from, and it is where the second tier of savings lives. Pine Island Chemical Solutions, a specialty chemical vendor, doubled its lab reporting productivity after connecting field sampling, lab analysis and client reporting in one workflow; the time went back into interpretation instead of transcription.
It is tempting to read all of this as a producer-versus-vendor story. It is not. The vendors who have adopted measured programs are the ones winning on performance instead of price.
The economics for a chemical company are different from a producer’s. The vendor’s cost is field labour and product margin. A field technician who captures pump rates, inventory, samples and photos once on a phone, with the data flowing straight to the lab and the client dashboard, covers more sites in a day. The How It Works analysis behind our own platform puts the field-staff productivity gain at up to 30 percent and the producer’s chemical savings at 8 to 15 percent, and both come from the same data.
The larger prize for vendors is the contract conversation. A vendor who can show a producer, from independent data, that treatment accuracy ran within 5 percent of target and that cost per BOE fell quarter over quarter is not negotiating on unit price. The Western Canadian vendor mentioned above used exactly that evidence to defend and expand its work.
Much of the industry’s investment in chemical monitoring over the last decade has gone into hardware: tank-level sensors, smart pumps and the IIoT platforms that come with them. The hardware is valuable. The problem is that each platform optimises only what its own devices can see. Lab results, production volumes and the thousands of sites that will never justify a sensor stay outside the loop.
A chemical program is a field problem, a lab problem and a production problem at the same time. The system that manages it has to be hardware-agnostic, pulling telemetry from whatever is installed, mobile capture from wherever it is not, production from accounting and results from the lab, into one model of each injection point. That is the design principle behind Prodesy, the chemical program management platform built by Embark Innovations, and it is the principle any operator should hold a vendor to, whoever the vendor is.
Operators who want to find out what their own variance looks like do not need a transformation program. They need one field, one chemical type and three months.
At the end of the quarter, the operator will have a number: the percentage of chemical spend that did not land where it was supposed to, and the KPI consequences where it did not. In our experience that number is rarely below 15 percent on a first measurement, and it is usually enough to fund everything that comes next.
The $660,000 was always there. The only thing that changed was that someone could see it.
About the author:
Michael Jones is CEO of Embark Innovations Inc., a Calgary-based software company that has built production chemical program management software for oil and gas producers and chemical vendors across Canada and the United States since 2015. Its Prodesy platform combines field capture, lab analysis, production data, telemetry and reporting in one hardware-agnostic system. www.embarkinnovations.com

Forging the Next 250 Years: Powering the Next Era of American Manufacturing
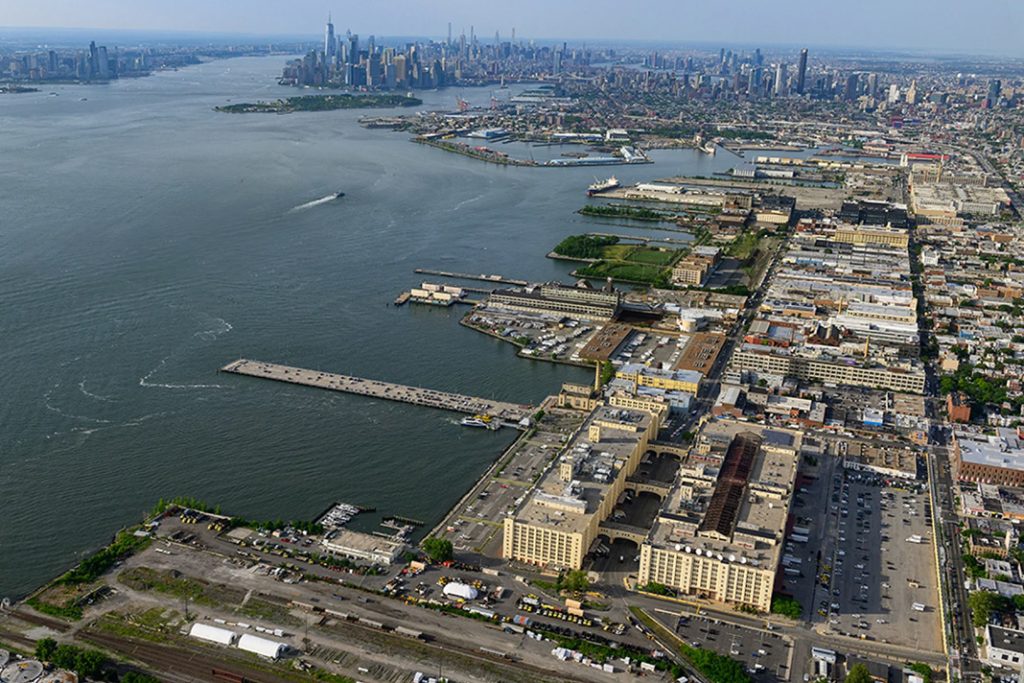
Brooklyn Army Terminal (BAT) began as a World War II-era military supply base. Today it is New York City’s largest publicly owned industrial campus, with 59 waterfront acres, more than 4 million square feet and over 100 businesses. In this episode of Industry Insights, Bridget Chansakul, Vice President of Leasing & Portfolio Management at NYCEDC, explains what space is available and what’s planned for the 250,000+ square feet of new industrial space in Building A. She also covers how the ferry, parking and on-site childcare help tenants hire and keep workers, along with workforce partnerships, City incentives for manufacturers and where BAT is headed next.
Get In Touch
Google news and SEO compliant, Industry Today’s state-of-the-art digital media platform offers bespoke media campaigns that target key decision makers and buyers to achieve your marketing and promotional goals.

Contribute
Showcase your brand and promote your business to our highly targeted audience. We offer detailed Google Analytics with measurable ROI to assure success. Submit your content for review by our Editorial team who will contact you to discuss the project further.
About Us
Reach Your Targeted Audience and Grow Your Business. Learn more About Industry Today.
Contact Us

© 2026 Industry today. All Rights reserved.